KCachegrind
by KDE
Profiler Frontend
Support the creators
Flatsonar is just the shop window. The people below made KCachegrind.
About
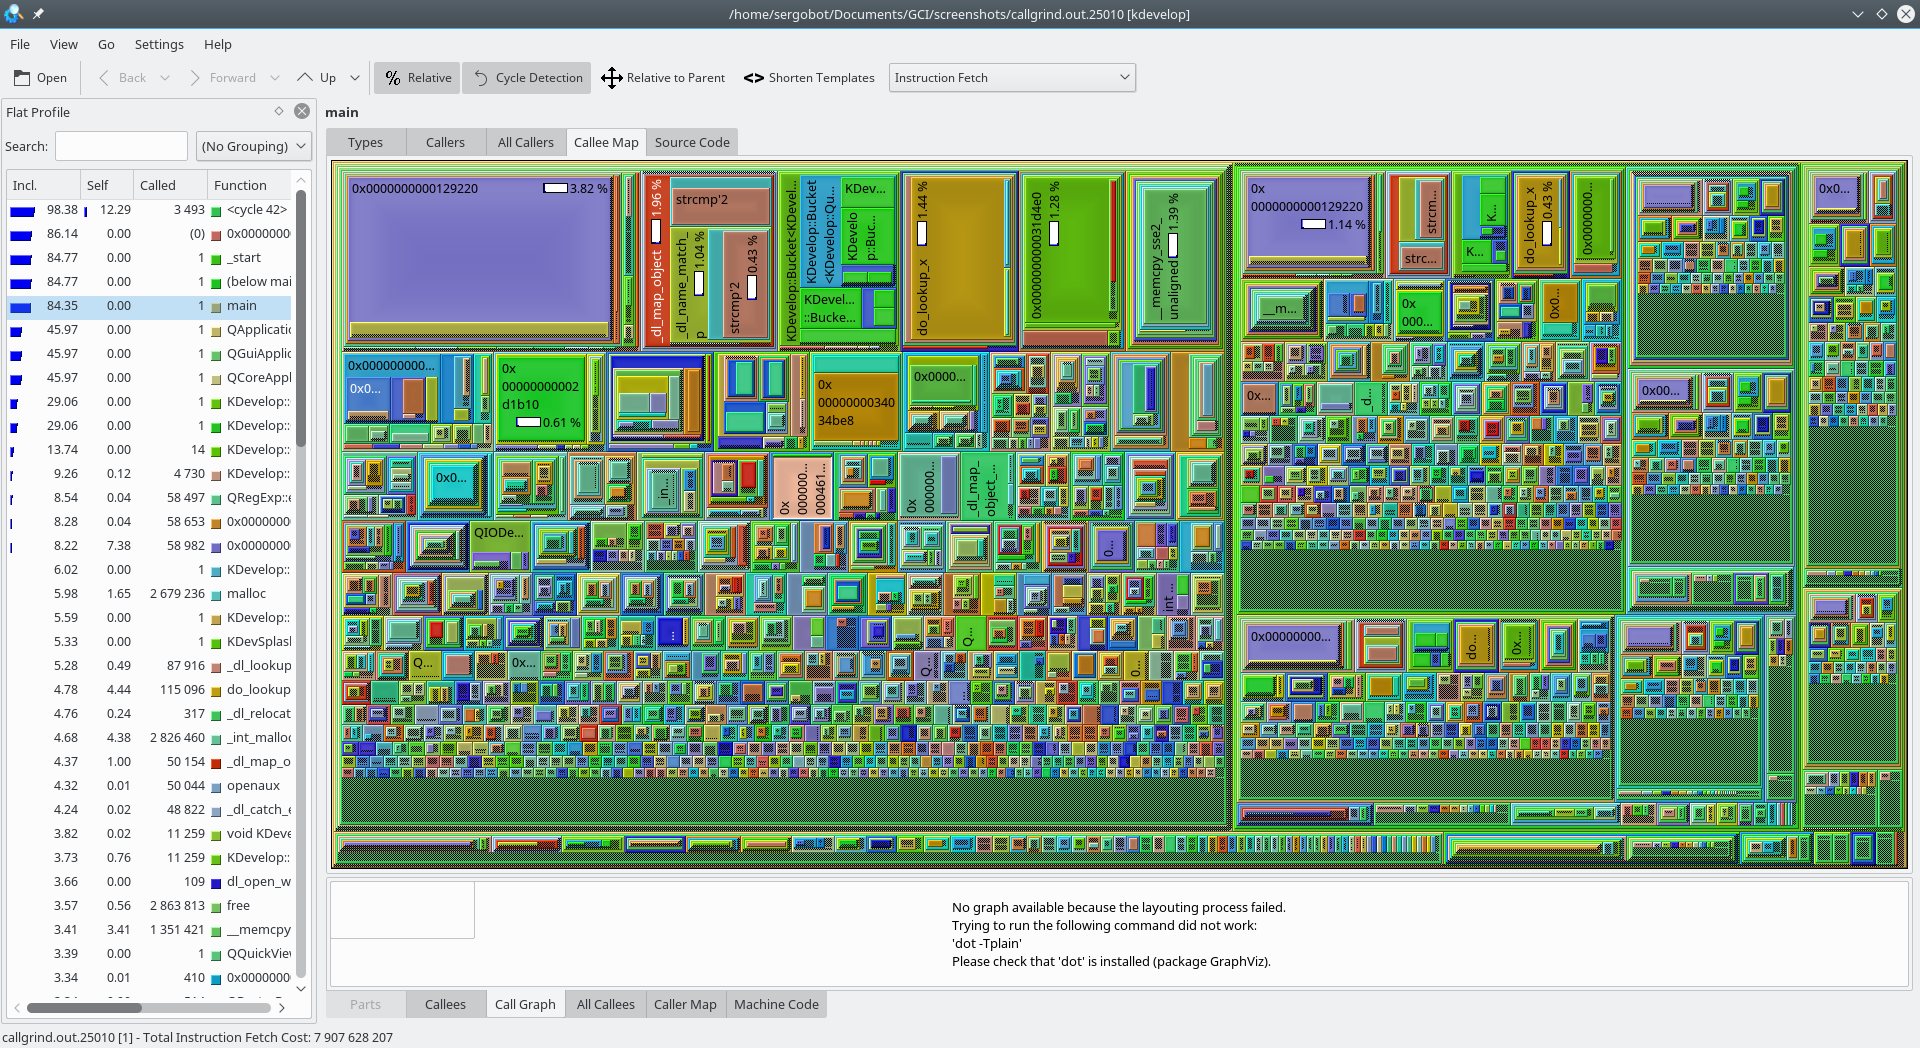
KCachegrind is a profile data visualization tool, used to determine the most time consuming parts in the execution of a program.
Features:
- KCachegrind visualizes profiles (i.e. runtime characteristics) of applications in various ways, including call graph visualisations and source/disassembler annotation. - It can load profiles generated by the cache simulation/call tracer Calltree, a Valgrind tool. Thus, profiling does not need any preparation, can cope with shared libraries and plugin architectures, and does not influence the measuring itself. - Converter scripts for OProfile, Perl, and PHP. - Switching between multiple visualization layouts. - Call graph can be exported as image (PNG). - Simultaneous display of 2 event types in Call and Annotation View
Permissions
1 permission weaken the sandbox. Flatsonar asks before installing.
- full access to your entire file system
--filesystem=host - inter-process communication (needed for X11)
--share=ipc - X11 display, only when Wayland is unavailable
--socket=fallback-x11 - Wayland display
--socket=wayland - GPU acceleration
--device=dri - access to xdg-config/kdeglobals
--filesystem=xdg-config/kdeglobals:ro - talks to com.canonical.AppMenu.Registrar
--talk-name=com.canonical.AppMenu.Registrar - talks to org.kde.kconfig.notify
--talk-name=org.kde.kconfig.notify - talks to org.kde.KGlobalSettings
--talk-name=org.kde.KGlobalSettings
Who publishes this
The creator demonstrably controls this app id: Flathub verification, the hosting account owns the namespace, or a well-known file on their domain.
- verified on Flathub: the developer proved they control this app id
publisher:flathub
Maintenance
Recent activity on the upstream repository, or built and reviewed by Flathub.
No staleness signals: recent activity, or built and reviewed by Flathub.